By Oliver Rovini and Greg Tate, Spectrum Instrumentation
Modular digitisers enable accurate, high-resolution data acquisition for quick transfer to a host computer. Signal processing functions, whether applied in the digitiser or the host computer, enhance the acquired data or extract useful information from a simple measurement.
Modern digitiser support software incorporates many signal processing features. These include waveform arithmetic, ensemble and boxcar averaging, Fast Fourier Transform (FFT), advanced filtering functions and histograms. This article, consisting of two parts, investigates all these functions and provides typical examples of common applications for these tools; this is part 2.
Weighting Functions
The theoretical Fourier transform assumes the input record is of infinite length, since a finite record length can introduce discontinuities at its edges, which introduces pseudo-frequencies in the spectral domain, distorting the real spectrum.
When the start and end phase of the signal differ, the signal frequency falls within two frequency bins, broadening the spectrum. The broadening of the spectral base, stretching out to many neighbouring bins, is termed leakage. Cures for this are to ensure that an integral number of periods is contained within the display grid, or that no discontinuities appear at the edges. Both approaches need very precise synchronisation between waveform signal frequency and digitiser sampling rate, and an exact setup of the acquisition length, which is normally only possible in the lab, and not with real-world signals.
Another method is to use a window function (weighting) to smooth the edges of the signal. To minimise these effects, a weighting function is applied to the acquired signal which forces the end points of the record to zero. Weighting functions have the effect of changing the shape of the spectral lines. One way of thinking about the FFT is that it synthesises a parallel bank of bandpass filters, spaced by the resolution bandwidth.
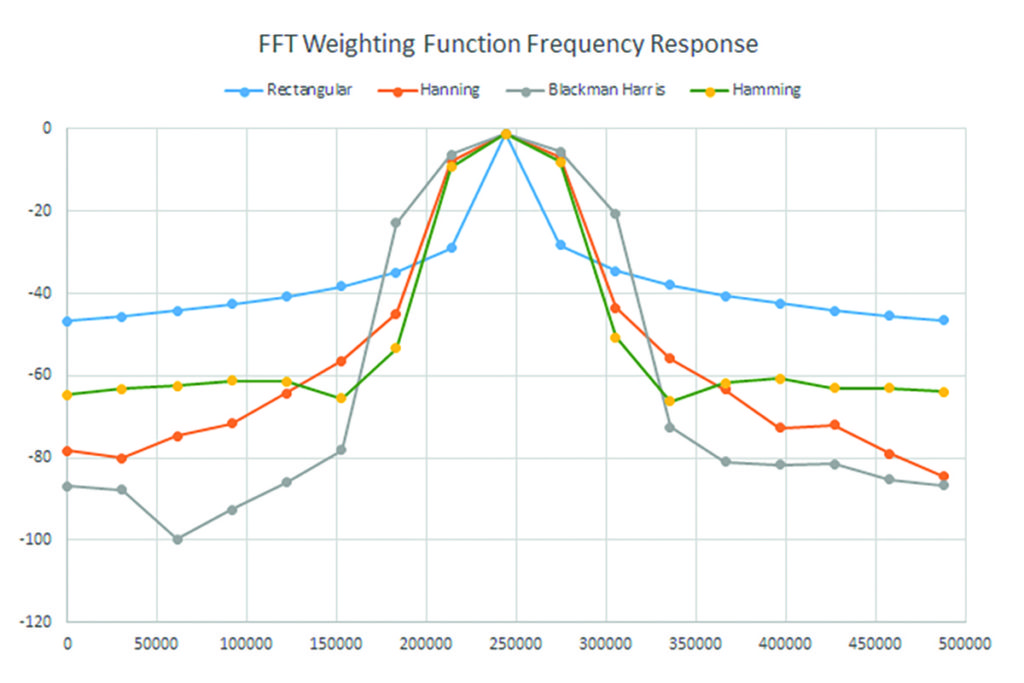
The weighting function affects the shape of the filter frequency response. Figure 1 compares the spectral responses for four of the most commonly-used weighting functions, and Table 1 shows the key characteristics of each.

Ideally, the main lobe should be as narrow and flat as possible to represent the true spectral components, while all side lobes should be infinitely attenuated. The window type defines the bandwidth and shape of the equivalent filter to be used in the FFT processing.
Maximum side-lobe amplitudes of the spectral response are shown in Table 1. Minimum side-lobe levels help discriminate between closely-spaced spectral elements.
| FFT Window Filter Parameters (Table 1) | ||||
| Window Type | Highest Side Lobe (dB) | Scallop Loss(dB) | ENBW (bins) | Coherent Gain (dB) |
| Rectangular | -13 | 3.92 | 1.0 | 0.0 |
| Hanning | -32 | 1.42 | 1.6 | -6.02 |
| Hamming | -43 | 1.78 | 1.37 | -5.35 |
| Blackman-Harris | -67 | 1.13 | 1.71 | -7.5 |
As mentioned previously, the FFT frequency axis is discrete, having bins spaced in multiples of the resolution bandwidth. If the input signal frequency falls between two adjacent bins, the energy is split between the bins, and the peak amplitude is reduced. This is called ‘picket fence’ effect or scalloping. Broadening the spectral response decreases amplitude variation. The scallop loss column in Table 1 specifies the amplitude variation for each weighting function.
Weighting functions affect the bandwidth of the spectral response. Effective noise bandwidth (ENBW) specifies the change in bandwidth relative to that of rectangular weighting. Normalising the power spectrum to the measurement bandwidth (power spectral density) requires dividing the power spectrum by the ENBW, times the resolution bandwidth.
Coherent gain specifies the change in spectral amplitude for a given weighting function relative to rectangular weighting. This is a fixed gain over all frequencies and can easily be normalised.
The rectangular weighting function is the response of the acquired signal without any weighting at all. It has the narrowest bandwidth but exhibits rather high side-lobe levels. Because the amplitude response is uniform over all points in the acquired time-domain record, it is used for signals transient in nature (much shorter than the record length). It is also used when best frequency accuracy is required.
The Hanning and Hamming weighting functions have good, general-purpose responses, providing good frequency resolution along with reasonable side-lobe response.
Blackman-Harris is intended for the best amplitude accuracy and excellent side-lobe suppression.
FFT Application Example
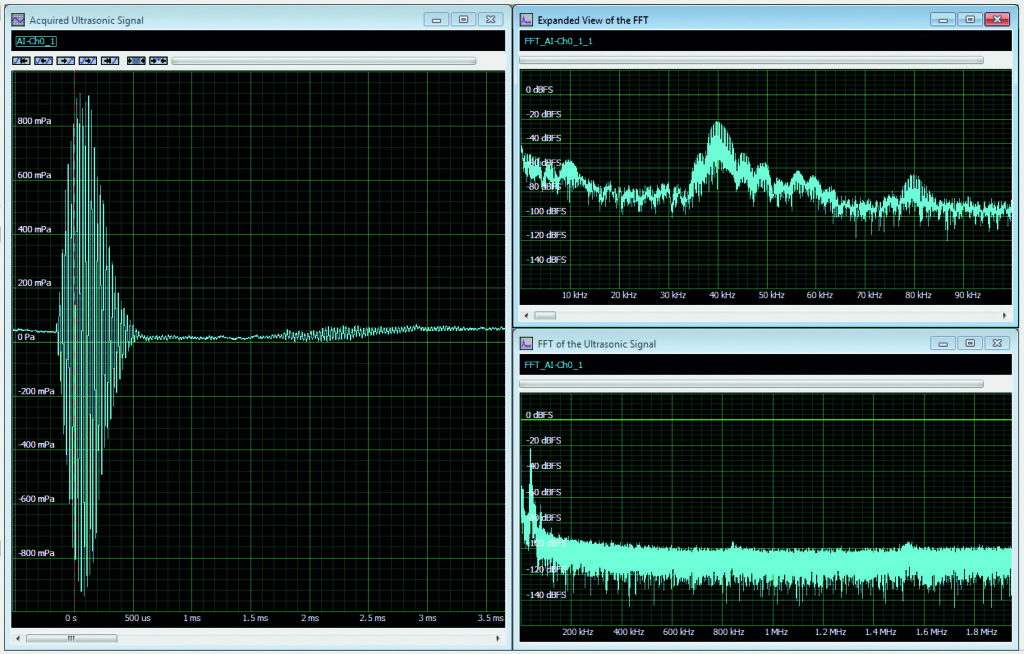
Figure 2 shows a typical example where the FFT is useful. The signal from an ultrasonic range finder is acquired using a broadband instrumentation microphone and a 14-bit digitiser.

The acquired time-domain signal is in the left grid. The record includes 16,384 samples taken at a sample rate of 3.90625MHz; its duration is 4.2ms. The resultant FFT (right grids) has 8,192 bins spaced at a resolution bandwidth of 238Hz (the reciprocal of the 4.2ms record length) for a span of 1.95MHz (half the sampling rate). The spectrum in the lower right is the full span. The zoom view in the upper right shows only the first 100kHz, for a better view of the main spectral components.
The FFT allows better understanding of the elements that make up this signal. It is a transient signal with duration shorter than the acquired record length. In this case, rectangular weighting has been used. The primary signal is the 40kHz burst, which is clearly the frequency component with the highest amplitude. There is an 80kHz signal, which is the second harmonic of the 40kHz component. Its amplitude is about 45dB below the 40kHz signal component. There are also many low-frequency components between 0Hz and 10kHz. The highest ones, those near DC, are ambient noise found in the room where the device was used.
The goal here is to be able to measure the time delay between the transmitted burst and the 40kHz reflection. To improve this measurement, we can remove the signal frequency components outside the 40kHz components range. This spectral view will be our guide in setting up a filter to remove the unwanted frequency components.
Filtering
The example shows finite impulse response (FIR) digital filters in lowpass, bandpass or highpass configuration. Filters can be created by entering the desired filter type, cut-off frequency or frequencies, and filter order. Alternatively, you can enter filter coefficients derived from another source. These filters can be applied to the acquired signal, and we can then compare the results with the raw or averaged acquisitions.
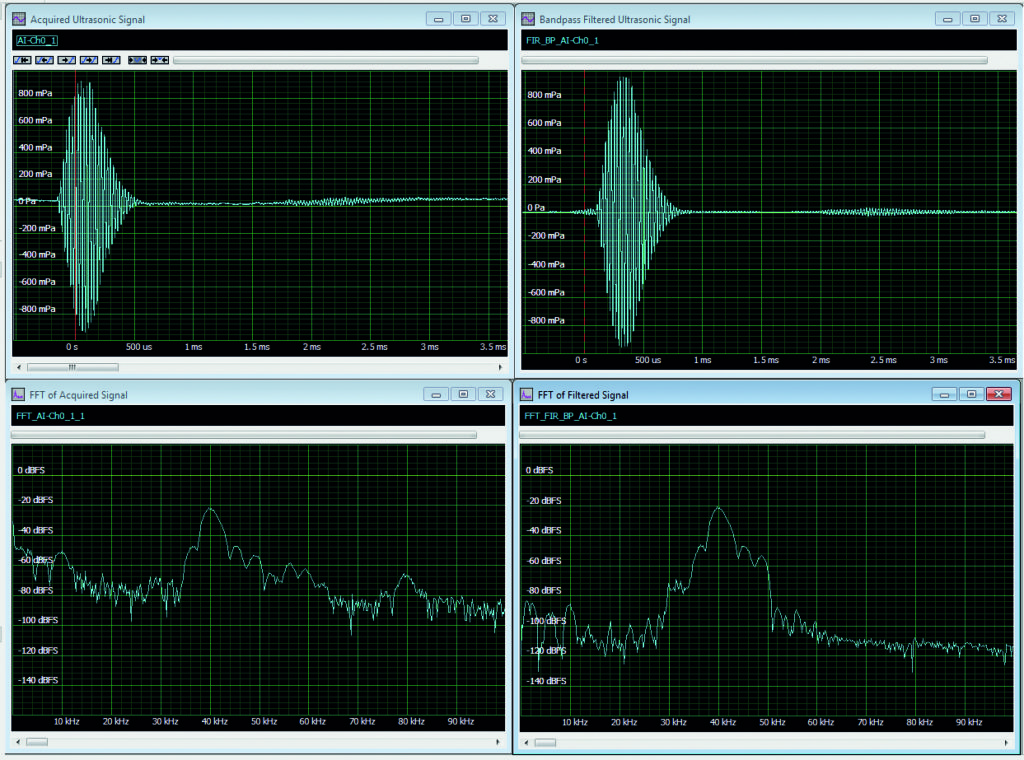
In Figure 3, a FIR bandpass filter with cut-off frequencies of 30 and 50kHz has been applied to the acquired signal. The upper left grid contains the raw waveform. Below that is the FFT of the raw signal that we have seen before. The upper right grid contains the bandpass filtered waveform. The FFT of the filtered signal is in the grid on the lower right. Note that the bandpass filter has eliminated the low-frequency pickup and the 80kHz second harmonic. The time-domain view of the filtered signal now has a flat baseline. The reflections are more clearly discernible, which is the goal of the processing. Again, the FFT provides great insight into the filtering process.

Histograms
So far, we have looked at data in both the time and frequency domains. Each of these views adds something to our understanding of the data being acquired.
The data can also be viewed in the statistical domain, which deals with the probability that certain amplitude values occur. This is conveyed by the histogram of occurrence frequency versus amplitude value.
The histogram is a finite record length estimate of the signal’s probability distribution. Some examples are shown in Figure 4, including sine, triangle and noise waveforms (top view) and their associated histogram distributions (bottom view). The horizontal axis of the histogram represents the amplitude of the signal, and the vertical the number of values in a small range of values (binning).

Each histogram distribution is distinct, and the difference is related to the signal characteristics. The distribution of the sine wave shows high peaks on either extreme and a saddle-shaped mid-region. The reason for this shaping is that the sinewave’s rate of change varies through each cycle, fastest at zero crossing and slowest at peaks. If the sine is sampled at a uniform sampling rate, there will be more samples at the positive (right-most peak in the histograms) and negative (left-most) peaks, and the fewest samples at the zero crossing (in the centre of the histogram, horizontally).
The triangle wave has a constant slope, either positive or negative. The resulting histogram has a uniform distribution, except at the extremes. The peaks are there because the signal generator has limited bandwidth that rounds the peaks, and a greater number of samples are acquired at those points.
The histogram of the noise signal results in a Gaussian or normal distribution. The unique characteristic of the Gaussian distribution is that it is not bounded; other distributions have amplitude limits and a fixed horizontal range. The Gaussian distribution has ‘tails’ that theoretically extend to infinity (in the actual instruments the tails are limited by clipping in the analogue-to-digital converter).
So, histograms tell their own stories about acquired signals. They are good at showing up asymmetries (distortion) and low probability glitches in waveforms. Figure 5 shows a histogram of a sine wave with a glitch at the zero crossing. The histogram clearly shows significant peaks near the zero crossing that are not present in the sine histogram in Figure 4.


