Instrumentation amplifiers are excellent for various measurements, including pressure and temperature. Their main tasks involve signal amplification and impedance adaptation.
In many cases, in-amps have a reference input pin. Adding a voltage at the reference pin will elevate the output signal by that voltage. This offers a simple and precise way to adjust the output of the instrumentation amplifier to the required input level of the ADC, creating the possibility for using the complete input span of the ADC with the benefit of higher resolution. An additional advantage is a very good common-mode rejection ratio (CMRR) and high precision in the case of a signal with a high common rail.
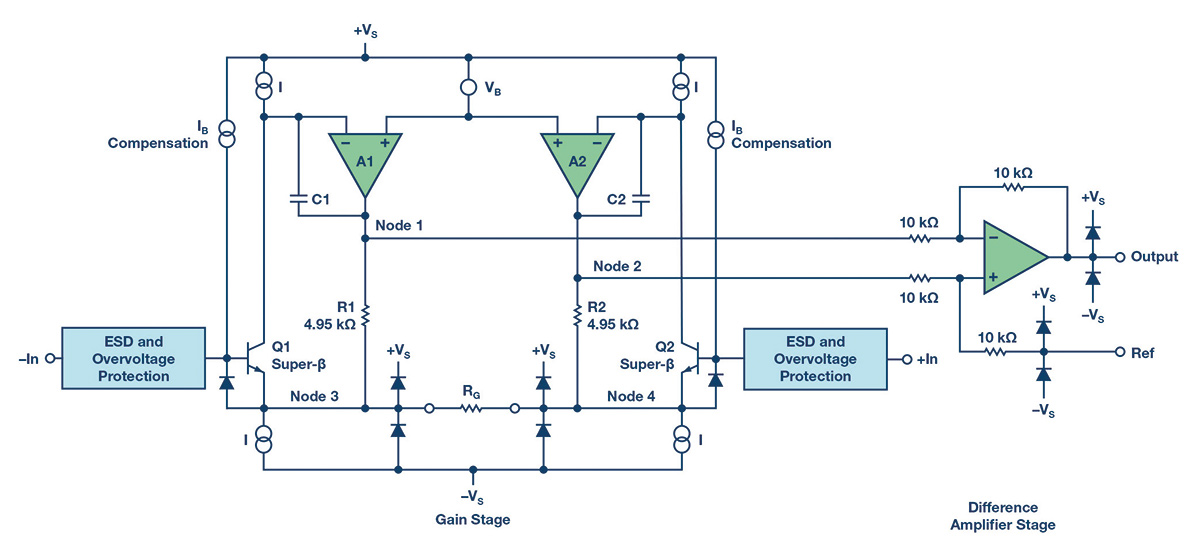
Figure 1 shows the internal schematic of an instrumentation amplifier in a typical three-opamp design.
If using an instrumentation amplifier, be aware that the maximum output voltage is dependent on the input signal (common-mode or differential), gain, power supply voltage and a possible limitation of the internal structure. In a three-opamp architecture, the first stage amplifier (inverting and non-inverting input) amplifies the input signal with a preset gain. The second stage works by subtraction; the output signal is built by subtraction of the two input signals. The reference voltage will be added to the signal, generating the combined output.
Based on this internal analogue signal generation, different factors could now lead to internal saturation and could reduce the maximum working area:
- Input voltage signal too high for the preset gain;
- Reference voltage too high for the generated output voltage signal;
- The power supply voltage is too low.
Because the output voltage and instrumentation amplifier’s working area depend on the maximum input signal, gain, reference voltage and limitations of the selected architecture, both are difficult to calculate. If you put these factors into a diagram, you would get a diamond-shaped graph, the so-called “diamond plot”. The space of the graph represents the possible working area. The calculation is not easy, as there are multiple inputs and outputs.
Instrumentation Amplifier Diamond Plot Tool
The instrumentation amplifier diamond plot tool was developed by Analog Devices as an online means for such calculations. The tool automatically calculates possible configurations for the reference, input signal, supply voltage and gain for a required output signal. It graphically displays the possible parameter combinations for a particular output signal.
The tool contains the specifications for all Analog Devices instrumentation amplifiers, and it’s fast and easy to use.
Figures 2-4 show the tool’s graphical user interface and the windows for its diamond plot, internal circuity and recommended tool options.

Within the first window (Figure 2), you can enter all the required parameters, calculate the diamond plot and visualise it (possible parameters include input signal, gain, supply voltage and reference voltage). For the input signal, you can choose from a common-mode signal or a differential signal. In addition, the tool also helps determine the limitations of the selected amplifier and differentiate between input-output and internal restrictions. It is now possible to estimate the working area, too. In general, it is recommended not to operate very close to the plot limits.
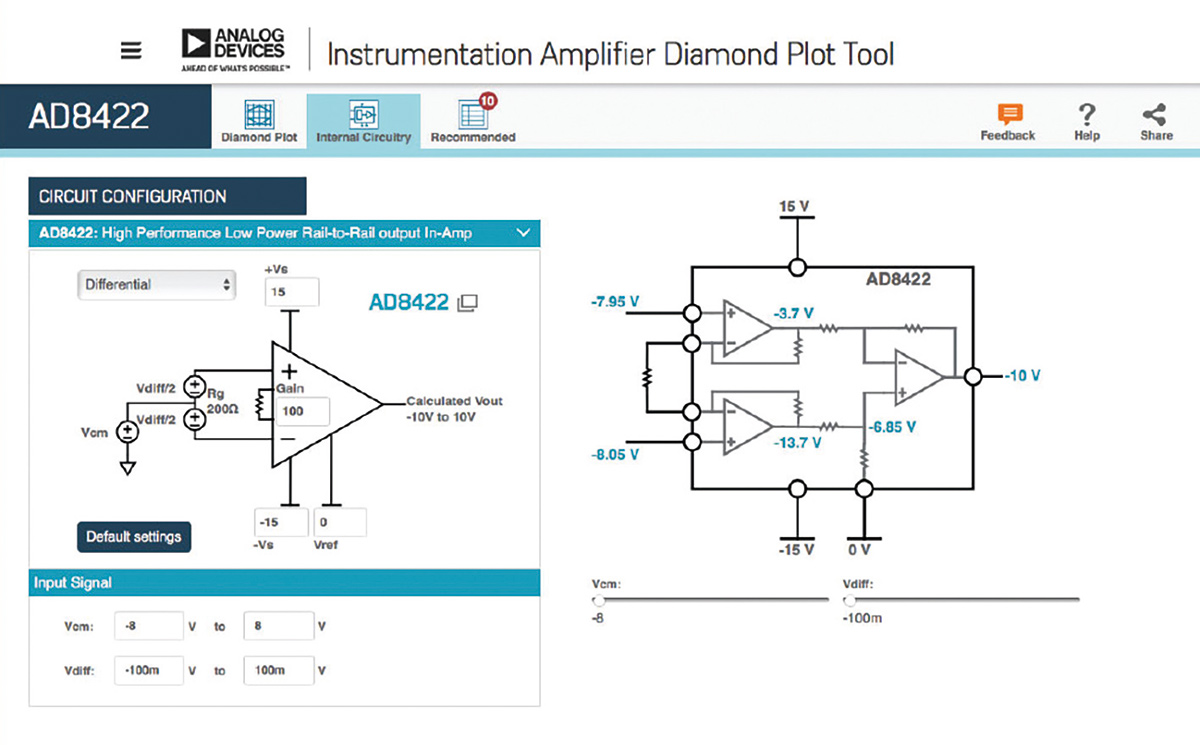
The second window of the instrumentation amplifier diamond plot tool offers an internal view of the amplifier and displays a detailed schematic; see Figure 3. With this view, it is possible to see the technical details and the respective internal voltages, important when checking for possible errors in the design. A control mode is also offered to evaluate and rate the selected parameters and provide alternatives; see Figure 4.